Nguyễn Cảnh Tuấn
  • TRANG CHỦ
  • GIỚI THIỆU
  • KHÓA HỌC ONLINE
    • Khóa 1 trên Edumall
    • Khóa 2 trên Edumall
    • Khóa 1 trên Unica
    • Khóa 2 trên Unica
    • Khóa 1 trên Kyna
    • Khóa 2 trên Kyna
  • IELTS
    • IELTS Writing
    • IELTS Speaking
    • IELTS Vocab
    • IELTS Listening
  • TOEIC
  • PODCAST
No Result
View All Result
  • TRANG CHỦ
  • GIỚI THIỆU
  • KHÓA HỌC ONLINE
    • Khóa 1 trên Edumall
    • Khóa 2 trên Edumall
    • Khóa 1 trên Unica
    • Khóa 2 trên Unica
    • Khóa 1 trên Kyna
    • Khóa 2 trên Kyna
  • IELTS
    • IELTS Writing
    • IELTS Speaking
    • IELTS Vocab
    • IELTS Listening
  • TOEIC
  • PODCAST
Nguyễn Cảnh Tuấn

Bài mẫu IELTS Writing Task 1 #11 [Pie chart]

by Callum Nguyễn
October 27, 2021
in IELTS Writing
Share on FacebookShare on PinterestShare on Linkedin

Có thể bạn quan tâm

IELTS Maps

Bài mẫu IELTS Writing Task 1 #22 [Maps]

January 21, 2022
Pie chart IELTS

Bài mẫu IELTS Writing Task 1 #21 [Pie chart]

January 7, 2022

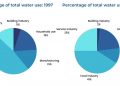
The charts below show the percentage of volunteers by organizations in 2008 and 2014.

Pie chart volunteers

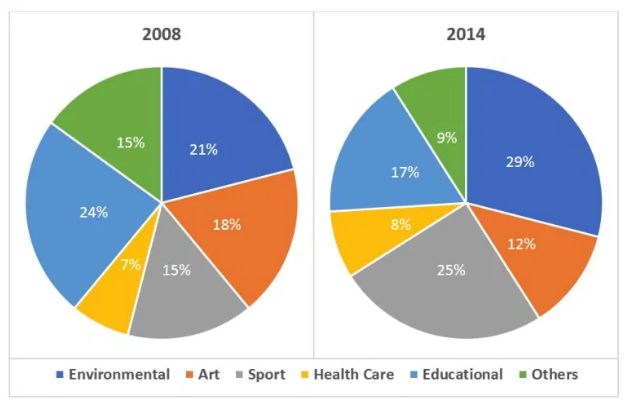
The provided pie charts illustrate the percentage of people doing voluntary work in various organizations in 2008 and 2014.

It is noticeable that the figures for volunteers in Educational, sport and health care organizations decreased while those in Environmental, art, and other ones declined over the 6-year-period. Also, Heath care remained the least attractive area to volunteers.

In 2008, almost a quarter of total volunteers worked for Environmental organizations, followed by Education, at 21%. The percentage for Environmental dropped by 7% to 17% in 2014 whereas Education witnessed a dramatic jump to 29%. Sport sector, which attracted 15% of voluntary personnel, experienced a remarkable increase to 25%., making it the second most favorite sector after Education in 2014.

The voluntary participation in art organizations went down from 18% in 2008 to 12% in 2014. Similarly, the figure for volunteers working in other organizations stood at 15% in 2008 and then fell to 9% in the following 6 years. The percentage for health care remained lowest in both 2008 and 2014, at 7% and 8%, respectively.

(174 words)

Bài mẫu được viết bởi Callum Nguyen. Nếu thấy bài viết này hữu ích hoặc có ý kiến phản hồi, hãy bình luận bên dưới nhé! Xem thêm các bài mẫu IELTS Writing Task 1 của mình tại đây

Bình luận Facebook
Tags: Writing task 1

Related Posts

IELTS Maps

Bài mẫu IELTS Writing Task 1 #22 [Maps]

January 21, 2022
Pie chart IELTS

Bài mẫu IELTS Writing Task 1 #21 [Pie chart]

January 7, 2022
Process IELTS

Bài mẫu IELTS Writing Task 1 #20 [Process]

December 27, 2021
diagram

Bài mẫu IELTS Writing Task 1 #19 [Process]

December 27, 2021
pie chart ielts

Bài mẫu IELTS Writing Task 1 #18 [Pie chart]

December 19, 2021
Bài mẫu IELTS Writing Task 1 #17 [Table]

Bài mẫu IELTS Writing Task 1 #17 [Table]

December 14, 2021
LINE GRAPH

Bài mẫu IELTS Writing Task 1 #16 [Line graph]

December 6, 2021
table IELTS

Bài mẫu IELTS Writing Task 1 #15 [Table]

December 1, 2021
Load More
Next Post
Line graph

Bài mẫu IELTS Writing Task 1 #12 [Line graph]

từ vựng chủ đề crime

Từ vựng chủ đề Crime

Facebook
No Result
View All Result

Chào mừng bạn đến với Blog học Tiếng Anh nguyencanhtuan.com. Đây là nơi mình tổng hợp những tài liệu và bài học thú vị về IELTS và TOEIC. Hãy ghé thăm thường xuyên nhé.

Tags

IELTS Cam 16 (1) IELTS ideas (1) IELTS Listening (7) IELTS Speaking (2) IELTS vocab (1) Speaking Part 1 (9) Writing task 1 (26) Writing task 2 (5)
May 2022
M T W T F S S
 1
2345678
9101112131415
16171819202122
23242526272829
3031  
« Feb    

Xây dựng và thiết kế bởi Callum Nguyen

No Result
View All Result
  • TRANG CHỦ
  • GIỚI THIỆU
  • KHÓA HỌC ONLINE
    • Khóa 1 trên Edumall
    • Khóa 2 trên Edumall
    • Khóa 1 trên Unica
    • Khóa 2 trên Unica
    • Khóa 1 trên Kyna
    • Khóa 2 trên Kyna
  • IELTS
    • IELTS Writing
    • IELTS Speaking
    • IELTS Vocab
    • IELTS Listening
  • TOEIC
  • PODCAST