IELTS Writing

Bài mẫu IELTS Writing Task 2 #1
In some countries more and more parents begin to teach their children at home rather than send them to school....

Bài mẫu IELTS Writing Task 1 #28 [Bar]
The first chart below shows the percentages of women and men in a country involved in some kinds of home...

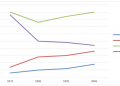
Bài mẫu IELTS Writing Task 1 #27 [Line]
The graph below shows the number of overseas visitors to three different areas in a European country between 1987 and...

Bài mẫu IELTS Writing Task 1 #26 [Process]
Bài mẫu được viết bởi Callum Nguyen và được đánh giá/cho điểm bởi thầy Peter Wright, cựu giám khảo IELTS với 25 năm...

Bài mẫu IELTS Writing Task 1 #25 [Table]
The table below shows the consumption of three basic foods, rice, wheat and maize, by people in four different countries...

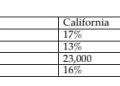
Bài mẫu IELTS Writing Task 1 #24 [Table]
Bài mẫu được viết bởi Callum Nguyen và được đánh giá/cho điểm bởi thầy Peter Wright, cựu giám khảo IELTS với 25 năm...

Bài mẫu IELTS Writing Task 1 #23 [Pie]
The charts below show the proportion of holidaymakers using four different types of accommodation in three different years. The...

Bài mẫu IELTS Writing Task 1 #22 [Maps]
The diagrams below show the plan of a medical centre in 2008 and 2010 The given diagrams illustrate the changes...

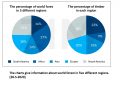
Bài mẫu IELTS Writing Task 1 #21 [Pie chart]
The charts below show the percentage of water used by different sectors in Sydney, Australia, 1997 and 2007. Summarise the...

Bài mẫu IELTS Writing Task 1 #20 [Process]
The diagram below shows two different processes for manufacturing black tea. The provided diagram illustrates how black tea is manufactured...