

The chart below gives information about car ownership in the UK from 1975 to 2005.
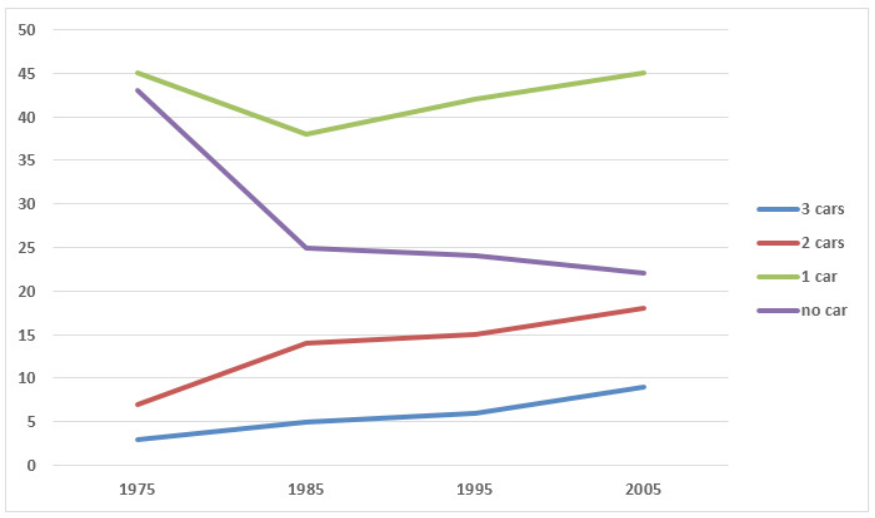
The provided line graph illustrates the changes in number of cars British people owned from 1995 to 2005.
It is noticeable that more people owned cars over the period shown. Additionally, the figure for people with 1 car was consistently highest while the opposite was true for people with 3 cars.
In 1975, 45% of people in UK owned a single car while the percentage of those with no car was 2% lower, at 43%. Over the following decade, these figures both decreased, with one-car ownership down to 38% and no-car ownership to 25%. While the proportion for British people owning 1 car steadily increased and reached its exact number in 1975 at 45%, the figure for people with no car gradually went down to only 22%.
The percentage of people with 2 and 3 cars experienced a similar pattern over the given period. The figure for people owning 2 cars stood at 7% in 1975, which was 4% higher compared to that for people owning 3 cars. They both increased steadily and reached their highs of 18% (people with 2 cars) and 4% (people with 3 cars).
(188 words)
Bài mẫu được viết bởi Callum Nguyen. Nếu thấy bài viết này hữu ích hoặc có ý kiến phản hồi, hãy bình luận bên dưới nhé! Xem thêm các bài mẫu IELTS Writing Task 1 của mình tại đây


![Bài mẫu IELTS Writing Task 1 #17 [Table]](https://nguyencanhtuan.com/wp-content/uploads/2021/12/ielts-table-120x86.png)

![Bài mẫu IELTS Writing Task 1 #14 [Bar chart]](https://nguyencanhtuan.com/wp-content/uploads/2021/11/Bar-charts-120x86.png)


