Nguyễn Cảnh Tuấn
  • TRANG CHỦ
  • GIỚI THIỆU
  • KHÓA HỌC ONLINE
    • Khóa 1 trên Edumall
    • Khóa 2 trên Edumall
    • Khóa 1 trên Unica
    • Khóa 2 trên Unica
    • Khóa 1 trên Kyna
    • Khóa 2 trên Kyna
  • IELTS
    • IELTS Writing
    • IELTS Speaking
    • IELTS Vocab
    • IELTS Listening
  • TOEIC
  • PODCAST
No Result
View All Result
  • TRANG CHỦ
  • GIỚI THIỆU
  • KHÓA HỌC ONLINE
    • Khóa 1 trên Edumall
    • Khóa 2 trên Edumall
    • Khóa 1 trên Unica
    • Khóa 2 trên Unica
    • Khóa 1 trên Kyna
    • Khóa 2 trên Kyna
  • IELTS
    • IELTS Writing
    • IELTS Speaking
    • IELTS Vocab
    • IELTS Listening
  • TOEIC
  • PODCAST
Nguyễn Cảnh Tuấn

Bài mẫu IELTS Writing Task 1 #10 [Pie chart]

by Callum Nguyễn
February 18, 2022
in IELTS Writing
Share on FacebookShare on PinterestShare on Linkedin

Có thể bạn quan tâm

IELTS Maps

Bài mẫu IELTS Writing Task 1 #22 [Maps]

January 21, 2022
Pie chart IELTS

Bài mẫu IELTS Writing Task 1 #21 [Pie chart]

January 7, 2022

The charts below show the percentage of electricity consumed by different sectors in Eastern Australia in 2007 and 2010.

Pie charts IELTS

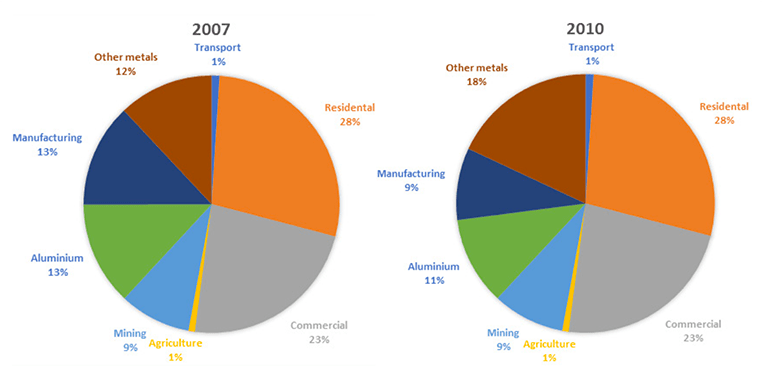
The provided pie charts compare the consumption of electricity in various sectors in Eastern Australia in 2007 and 2010.
It is noticeable that residential use made up the largest proportion while the opposite was true for agriculture and transport. Other metals was the only sector experiencing the rise in electricity consumption whereas most of the other areas remained the same.
In 2007, 12% of total power consumed came from other metals’ sector, which was slightly lower than manufacturing and aluminium sector, at 13%. The use of electricity in other metals increased to 18% in 2010 while the opposite trend was observed in manufacturing and aluminium as the figures went down to 9% and 11%, respectively.
Residential consumption of power accounted for 28% in 2007 while the percentage for agriculture and transport stood at only 1%. Commercial sector constituted slightly less than a quarter of total power use, which was 14% higher than mining industry, at 9%. The figures for all these sectors remained exactly the same in 2010.

(166 words)

Bài mẫu được viết bởi Callum Nguyen. Nếu thấy bài viết này hữu ích hoặc có ý kiến phản hồi, hãy bình luận bên dưới nhé! Xem thêm các bài mẫu IELTS Writing Task 1 của mình tại đây


Bình luận Facebook
Tags: Writing task 1

Related Posts

IELTS Maps

Bài mẫu IELTS Writing Task 1 #22 [Maps]

January 21, 2022
Pie chart IELTS

Bài mẫu IELTS Writing Task 1 #21 [Pie chart]

January 7, 2022
Process IELTS

Bài mẫu IELTS Writing Task 1 #20 [Process]

December 27, 2021
diagram

Bài mẫu IELTS Writing Task 1 #19 [Process]

December 27, 2021
pie chart ielts

Bài mẫu IELTS Writing Task 1 #18 [Pie chart]

December 19, 2021
Bài mẫu IELTS Writing Task 1 #17 [Table]

Bài mẫu IELTS Writing Task 1 #17 [Table]

December 14, 2021
LINE GRAPH

Bài mẫu IELTS Writing Task 1 #16 [Line graph]

December 6, 2021
table IELTS

Bài mẫu IELTS Writing Task 1 #15 [Table]

December 1, 2021
Load More
Next Post
Pie chart volunteers

Bài mẫu IELTS Writing Task 1 #11 [Pie chart]

Line graph

Bài mẫu IELTS Writing Task 1 #12 [Line graph]

Facebook
No Result
View All Result

Chào mừng bạn đến với Blog học Tiếng Anh nguyencanhtuan.com. Đây là nơi mình tổng hợp những tài liệu và bài học thú vị về IELTS và TOEIC. Hãy ghé thăm thường xuyên nhé.

Tags

IELTS Cam 16 (1) IELTS ideas (1) IELTS Listening (7) IELTS Speaking (2) IELTS vocab (1) Speaking Part 1 (9) Writing task 1 (26) Writing task 2 (5)
May 2022
M T W T F S S
 1
2345678
9101112131415
16171819202122
23242526272829
3031  
« Feb    

Xây dựng và thiết kế bởi Callum Nguyen

No Result
View All Result
  • TRANG CHỦ
  • GIỚI THIỆU
  • KHÓA HỌC ONLINE
    • Khóa 1 trên Edumall
    • Khóa 2 trên Edumall
    • Khóa 1 trên Unica
    • Khóa 2 trên Unica
    • Khóa 1 trên Kyna
    • Khóa 2 trên Kyna
  • IELTS
    • IELTS Writing
    • IELTS Speaking
    • IELTS Vocab
    • IELTS Listening
  • TOEIC
  • PODCAST