Nguyễn Cảnh Tuấn
  • TRANG CHỦ
  • GIỚI THIỆU
  • KHÓA HỌC ONLINE
    • Khóa 1 trên Edumall
    • Khóa 2 trên Edumall
    • Khóa 1 trên Unica
    • Khóa 2 trên Unica
    • Khóa 1 trên Kyna
    • Khóa 2 trên Kyna
  • IELTS
    • IELTS Writing
    • IELTS Speaking
    • IELTS Vocab
    • IELTS Listening
  • TOEIC
  • PODCAST
No Result
View All Result
  • TRANG CHỦ
  • GIỚI THIỆU
  • KHÓA HỌC ONLINE
    • Khóa 1 trên Edumall
    • Khóa 2 trên Edumall
    • Khóa 1 trên Unica
    • Khóa 2 trên Unica
    • Khóa 1 trên Kyna
    • Khóa 2 trên Kyna
  • IELTS
    • IELTS Writing
    • IELTS Speaking
    • IELTS Vocab
    • IELTS Listening
  • TOEIC
  • PODCAST
Nguyễn Cảnh Tuấn

Bài mẫu IELTS Writing Task 1 #08 [Bar chart]

by Callum Nguyễn
October 18, 2021
in IELTS Writing
Share on FacebookShare on PinterestShare on Linkedin

Có thể bạn quan tâm

IELTS Maps

Bài mẫu IELTS Writing Task 1 #22 [Maps]

January 21, 2022
Pie chart IELTS

Bài mẫu IELTS Writing Task 1 #21 [Pie chart]

January 7, 2022

The bar chart illustrates the number of people in the UK eating more than 5 portions of vegetables and fish per day. Summarise the information by selecting and reporting the main features, and make comparisons where relevant.

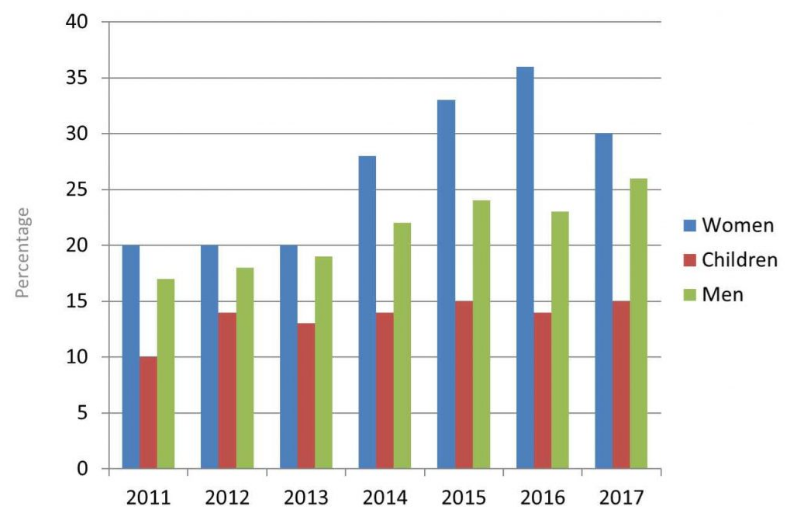
The provided bar chart illustrates the proportion of British people consuming more than 5 portions of vegetables and fish on a daily basis from 2011 to 2017.

It is noticeable that women were consistently the major consumers of those food while the opposite was true for children. Also, there was an increase in the percentages of women, men, and children over the period shown.

In 2011, 20% of women had more than 5 portions of vegetables and fish daily whereas the proportion for children was half as high, at 10%. The figure for women, which remained unchanged until 2013, increased sharply to 36% in 2016 before dropping to 30% in 2017. Meanwhile, the percentage for children witnessed an increase to 14% in 2012 and fluctuated slightly before reaching 15% in 2017.

The proportion of men stood at 17% at the beginning and climbed steadily to 26% in 2017, except for a slight decrease to 23% in 2016.

(158 words)

Bài mẫu được viết bởi Callum Nguyen. Nếu thấy bài viết này hữu ích hoặc có ý kiến phản hồi, hãy bình luận bên dưới nhé! Xem thêm các bài mẫu IELTS Writing Task 1 của mình tại đây

Bình luận Facebook
Tags: Writing task 1

Related Posts

IELTS Maps

Bài mẫu IELTS Writing Task 1 #22 [Maps]

January 21, 2022
Pie chart IELTS

Bài mẫu IELTS Writing Task 1 #21 [Pie chart]

January 7, 2022
Process IELTS

Bài mẫu IELTS Writing Task 1 #20 [Process]

December 27, 2021
diagram

Bài mẫu IELTS Writing Task 1 #19 [Process]

December 27, 2021
pie chart ielts

Bài mẫu IELTS Writing Task 1 #18 [Pie chart]

December 19, 2021
Bài mẫu IELTS Writing Task 1 #17 [Table]

Bài mẫu IELTS Writing Task 1 #17 [Table]

December 14, 2021
LINE GRAPH

Bài mẫu IELTS Writing Task 1 #16 [Line graph]

December 6, 2021
table IELTS

Bài mẫu IELTS Writing Task 1 #15 [Table]

December 1, 2021
Load More
Next Post
Bar chart

Bài mẫu IELTS Writing Task 1 #09 [Line graph]

học IELTS

Lượm lặt những mẫu câu Tiếng Anh hay

Facebook
No Result
View All Result

Chào mừng bạn đến với Blog học Tiếng Anh nguyencanhtuan.com. Đây là nơi mình tổng hợp những tài liệu và bài học thú vị về IELTS và TOEIC. Hãy ghé thăm thường xuyên nhé.

Tags

IELTS Cam 16 (1) IELTS ideas (1) IELTS Listening (7) IELTS Speaking (2) IELTS vocab (1) reading actual test 2022 (1) Speaking Part 1 (9) Writing task 1 (26) Writing task 2 (5)
June 2022
M T W T F S S
 12345
6789101112
13141516171819
20212223242526
27282930  
« May    

Xây dựng và thiết kế bởi Callum Nguyen

No Result
View All Result
  • TRANG CHỦ
  • GIỚI THIỆU
  • KHÓA HỌC ONLINE
    • Khóa 1 trên Edumall
    • Khóa 2 trên Edumall
    • Khóa 1 trên Unica
    • Khóa 2 trên Unica
    • Khóa 1 trên Kyna
    • Khóa 2 trên Kyna
  • IELTS
    • IELTS Writing
    • IELTS Speaking
    • IELTS Vocab
    • IELTS Listening
  • TOEIC
  • PODCAST