Bài mẫu IELTS Writing Task 1 #12 [Line graph]
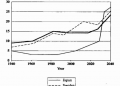
The graph below shows the population of a particular country by age group starting in 1960 and including a forecast ...

The graph below shows the population of a particular country by age group starting in 1960 and including a forecast ...

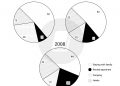
The charts below show the percentage of volunteers by organizations in 2008 and 2014. The provided pie charts illustrate the ...
![Bài mẫu IELTS Writing Task 1 #17 [Table]](https://nguyencanhtuan.com/wp-content/uploads/2021/12/ielts-table-120x86.png)