Bài mẫu IELTS Writing Task 1 #10 [Pie chart]
The charts below show the percentage of electricity consumed by different sectors in Eastern Australia in 2007 and 2010. The ...

The charts below show the percentage of electricity consumed by different sectors in Eastern Australia in 2007 and 2010. The ...

Động từ mang nghĩa "chiếm" Make up (made up) Account for (accounted for) Comprise (comprised) Constitute (constituted) Occupy (occupied) Từ ...

The charts below give information about the price of tickets on one airline between Sydney and Melbourne, over a two-week ...
![Bài mẫu IELTS Writing Task 1 #08 [Bar chart]](https://nguyencanhtuan.com/wp-content/uploads/2021/08/Bar-chart-350x250.png)
The bar chart illustrates the number of people in the UK eating more than 5 portions of vegetables and fish ...

The chart below shows the average cost of monthly contract for four different mobile (cell phones) in a European country ...

The chart below gives information about car ownership in the UK from 1975 to 2005. The provided line graph illustrates ...

The chart below shows information about fuel used in transport sector in 6 EU countries, compared to the average. The ...

The map shows changes in a city in 1950 and now. The provided maps illustrate the changes in a city ...

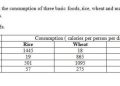
The table below presents the food consumption per person weekly in a European country in 1992, 2002 and 2012. The ...

The plans below show a student room for two people and a student for one person at an Australian university. ...

![Bài mẫu IELTS Writing Task 1 #08 [Bar chart]](https://nguyencanhtuan.com/wp-content/uploads/2021/08/Bar-chart-120x86.png)
![Bài mẫu IELTS Writing Task 1 #14 [Bar chart]](https://nguyencanhtuan.com/wp-content/uploads/2021/11/Bar-charts-120x86.png)