Bài mẫu IELTS Writing Task 1 #16 [Line graph]
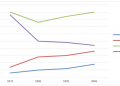
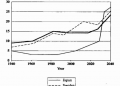
The graph below shows the proportion of the population aged 65 and over between 1940 and 2040 in three different ...

The graph below shows the proportion of the population aged 65 and over between 1940 and 2040 in three different ...
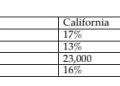
![Bài mẫu IELTS Writing Task 1 #17 [Table]](https://nguyencanhtuan.com/wp-content/uploads/2021/12/ielts-table-120x86.png)